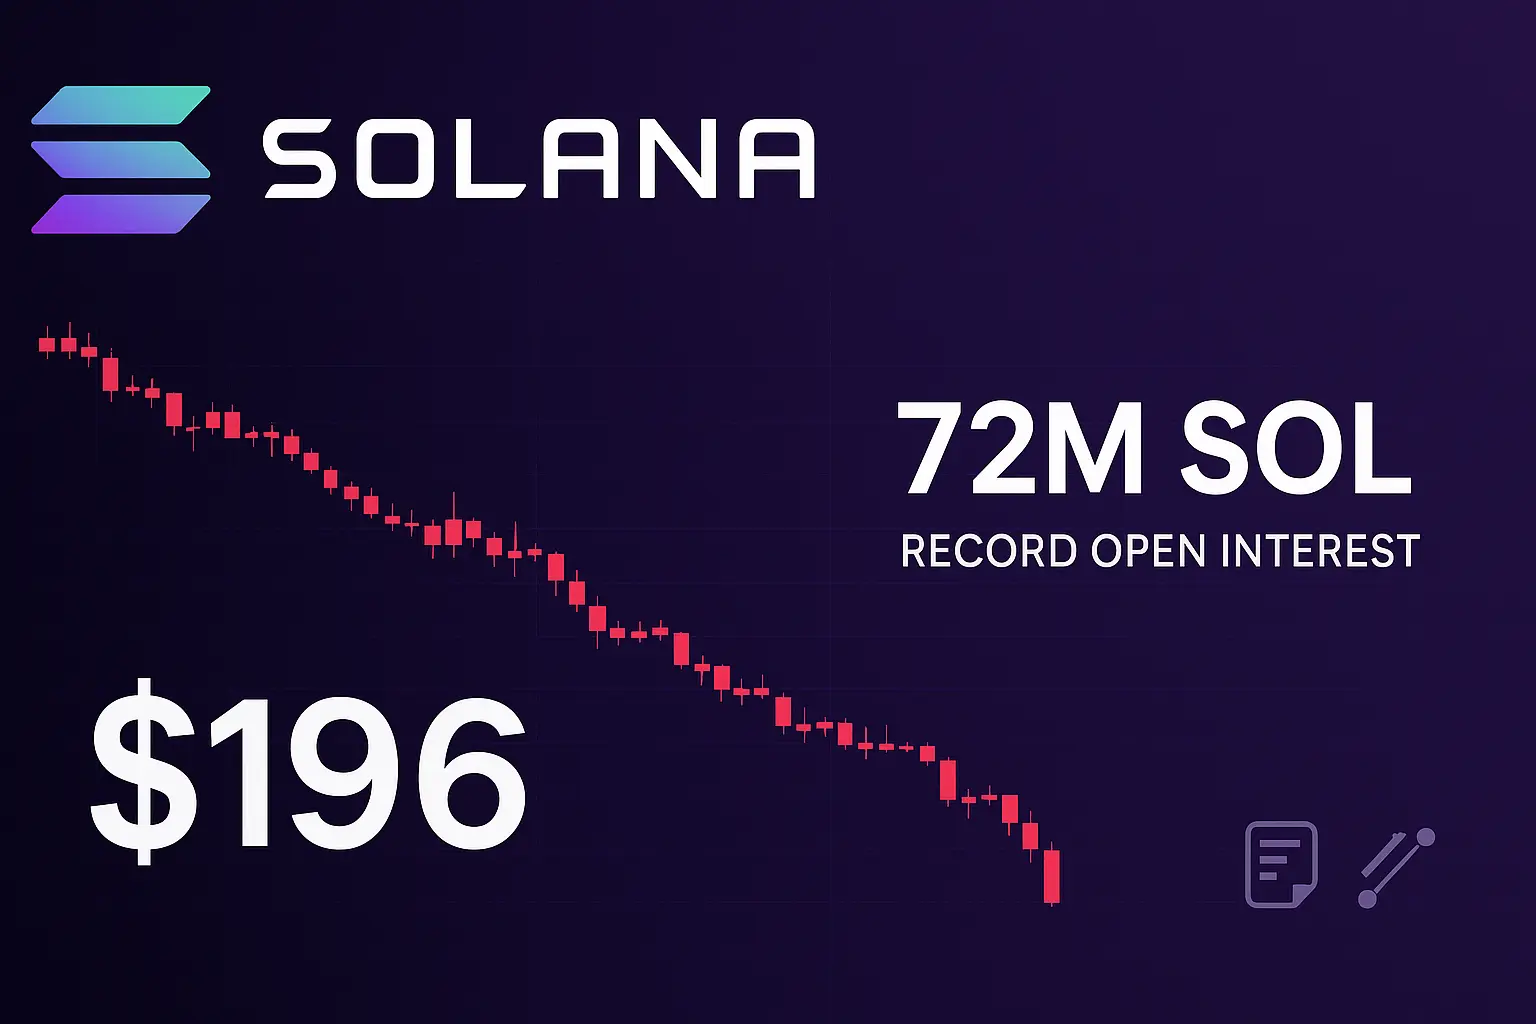
Solana futures open interest reached an all-time high of 72 million SOL tokens, even as the cryptocurrency experienced its worst week of 2025 with an 18% decline, raising questions about market positioning and potential further downside.
Record Open Interest Amid Price Weakness
The cryptocurrency market witnessed a paradoxical situation as Solana's futures open interest climbed to unprecedented levels while the token's price action showed significant weakness. According to CoinGlass data, SOL futures open interest hit a record 71.8 million tokens, valued at approximately $14.5 billion at current prices.
Key Market Metrics
Solana's futures open interest reached 71.8 million SOL tokens with $14.5 billion in notional value, while perpetual funding rates flipped positive to 0.0043% from -0.0065%.
This surge in open interest coincided with SOL experiencing one of its most challenging weeks in 2025, trailing only Hyperliquid among the top 20 cryptocurrency assets in terms of losses. The dramatic price decline has positioned SOL/USD for its lowest weekly candle close since late August, fueling market speculation about a potential move toward the $120 support level.
Market Structure Analysis
The combination of rising open interest and positive funding rates during a period of falling prices suggests an overleveraged market condition where long positions may be vulnerable to further liquidations. Net taker volume data reveals a sell-heavy bias, indicating that aggressive sellers are dominating market activity.
Higher open interest and rising funding rates amid falling prices could result in an overleveraged market where the longs are caught off guard.
Spot cumulative volume delta (CVD) has also declined, suggesting that the current sell-off is primarily driven by spot market activity rather than derivatives trading. This spot-driven selling pressure traditionally indicates more sustained bearish sentiment among holders.
Network Fundamentals Show Weakness
Beyond price action and derivatives metrics, Solana's underlying network activity has shown concerning trends that may be contributing to the bearish sentiment.
DeFi Ecosystem Decline
Data from DefiLlama reveals significant weaknesses in Solana's decentralized finance ecosystem over the past week. Total value locked (TVL) in Solana DeFi protocols decreased by 16%, while daily transactions dropped by 11% during the same period.
Network Activity Metrics
Solana DeFi protocols saw a 16% decrease in total value locked and an 11% decrease in daily transactions over the past seven days, indicating reduced network utilization.
These declining network metrics, combined with increasing competition from other layer-1 blockchain platforms, present significant headwinds for any potential short-term price recovery. The reduction in network activity suggests that users may be migrating to alternative platforms or reducing their overall engagement with Solana-based applications.
Technical Analysis: Path to $120?
From a technical analysis perspective, SOL's price action since early August has formed a concerning pattern that could indicate further downside potential.
Inverted V-Pattern Formation
The price movement between August 2 and the current period has created what appears to be an inverted V-shaped pattern on the daily chart. This formation typically indicates a failed rally attempt and suggests that bears successfully defended higher price levels.
The relative strength index (RSI) has declined significantly, dropping from 69 to 37 since September 18. This downward slope indicates increasing bearish momentum, though the RSI has not yet reached oversold territory, suggesting additional selling pressure could materialize.
Support Levels and Downside Targets
Technical analysis suggests that SOL could complete its inverted V-pattern by declining toward the neckline around the $155 demand zone. This scenario would represent approximately a 22% price drop from current levels.
A double-top formation on the weekly chart hints at a possible return to the pattern's neckline at $120, which would bring total losses to 40% from current levels.
On a broader timeframe, weekly chart analysis reveals the potential for a double-top formation, which could target the pattern's neckline near $120. Such a move would result in total losses of approximately 40% from current price levels.
Market Outlook and Risk Factors
The current market structure presents multiple risk factors that could contribute to continued price weakness for Solana. The combination of record-high open interest, positive funding rates, and declining network fundamentals creates a challenging environment for bullish positioning.
Competitive Landscape Pressures
Solana faces increasing competition from other layer-1 blockchain platforms, which may be contributing to the decline in network activity and user engagement. This competitive pressure, combined with the current technical weakness, suggests that any recovery may be limited in scope and duration.
The cryptocurrency's performance relative to other major assets in the top 20 rankings also indicates that Solana-specific factors, rather than broader market conditions, may be driving the recent underperformance.
Risk Assessment
The confluence of record open interest, weakening network metrics, and bearish technical patterns suggests continued downside risk for SOL, with key support levels at $155 and $120.
Traders and investors should monitor key support levels closely, particularly the $155 and $120 zones, as breaks below these levels could accelerate selling pressure and potentially trigger additional long liquidations in the derivatives markets.